

Quick answer: Candlestick patterns are one-, two- and three-candle shapes that show how buying and selling pressure shifted during a session. They are worth acting on only at a meaningful level, on a higher timeframe and after a confirming candle, and even then they describe pressure rather than predict price.
Each candle records four prices: open, high, low and close. The body spans open to close, the wicks reach the extremes, and the colour shows which side won the session. If that anatomy is new, our guide to candlestick charts covers it. Below, every pattern gets the same treatment: the shape, what it says about pressure and what confirms it. Each diagram shows the clean shape on the left and the pattern at a support or resistance level on the right; the context charts are illustrative, not real price data.
Single-Candle Patterns
Single-candle patterns compress one session’s fight into a single shape. They form often, which makes context and confirmation even more important than for the two- and three-candle forex candlestick patterns further down.
Doji
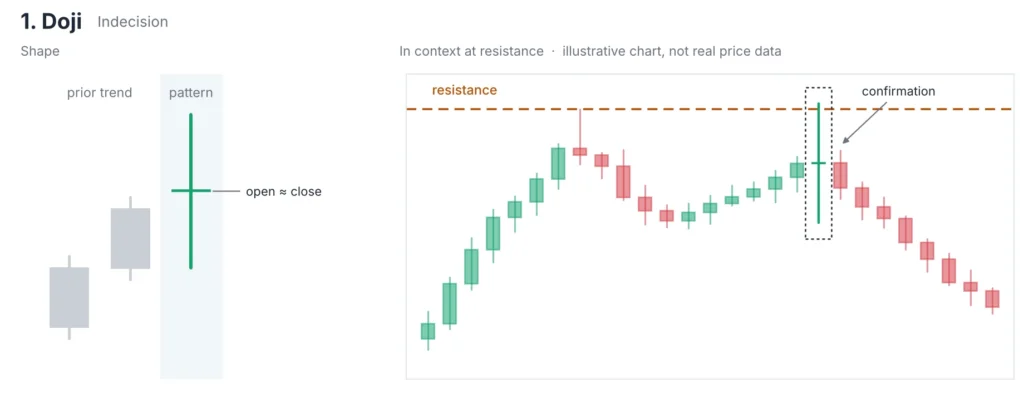
Doji: shape and example at resistance
- Shape: open and close at or very near the same price, with wicks on one or both sides.
- Pressure: buyers and sellers pushed price around and ended level. After a strong move into resistance, that stall tells you the side in control could not extend.
- Confirmation: a doji has no direction of its own. Wait for the next candle to close beyond the doji’s high or low and treat that close as the signal.
Hammer
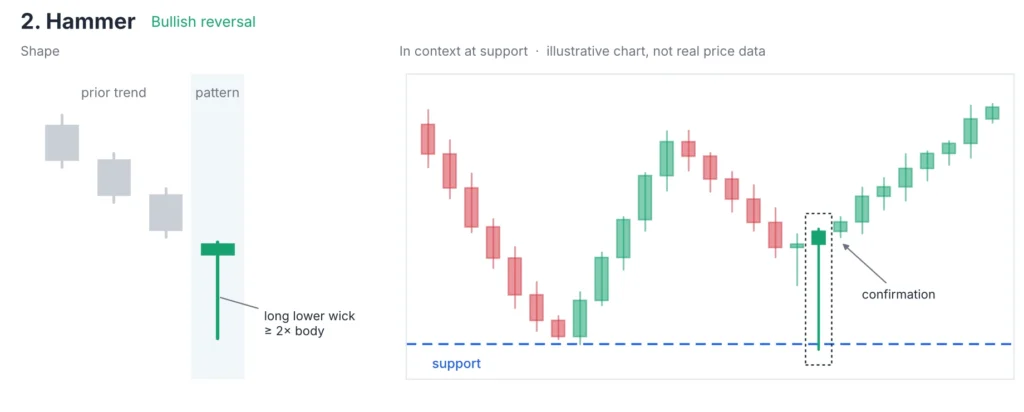
Hammer: shape and example at support
- Shape: small body near the top of the range, lower wick at least twice the body, little or no upper wick, after a decline.
- Pressure: sellers drove price well down during the session, then buyers pushed it back up near the open. The low marks where demand appeared.
- Confirmation: a following candle that closes above the hammer’s high. The body colour of the hammer itself matters less than where it forms.
Hanging Man
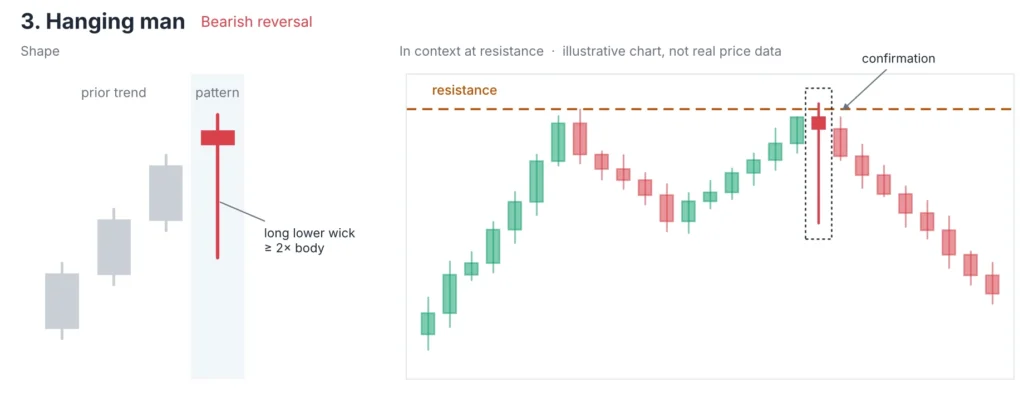
Hanging man: shape and example at resistance
- Shape: identical to a hammer, but it appears at the top of an advance.
- Pressure: the long lower wick shows sellers were strong enough to push price well down mid-session, even though buyers recovered most of it. At the top of an advance, that test of selling interest is an early warning.
- Confirmation: essential here. A close below the hanging man’s body turns the warning into a signal; without it, the uptrend is intact.
Shooting Star
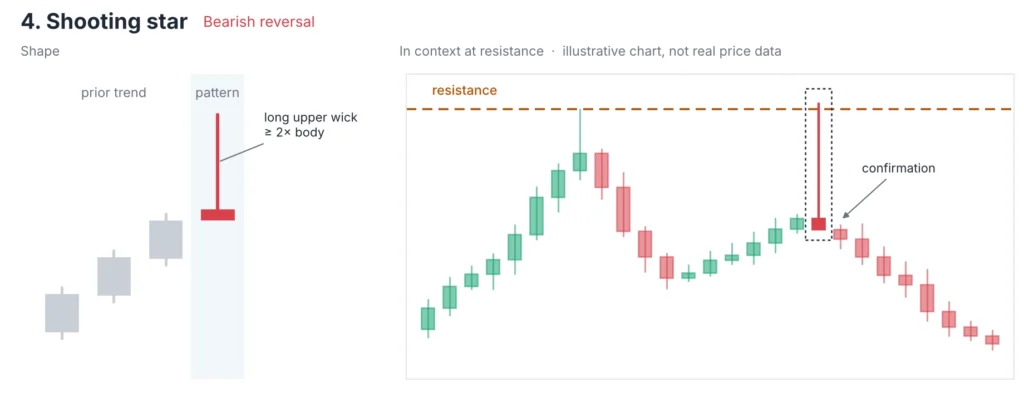
Shooting star with a long upper wick rejected at resistance
- Shape: small body near the bottom of the range, upper wick at least twice the body, at the end of an upswing.
- Pressure: buyers pushed into higher prices and were rejected, with sellers returning price to near the open. When the wick pierces a resistance level, the rejection carries more weight.
- Confirmation: a following candle closing below the shooting star’s low.
Marubozu
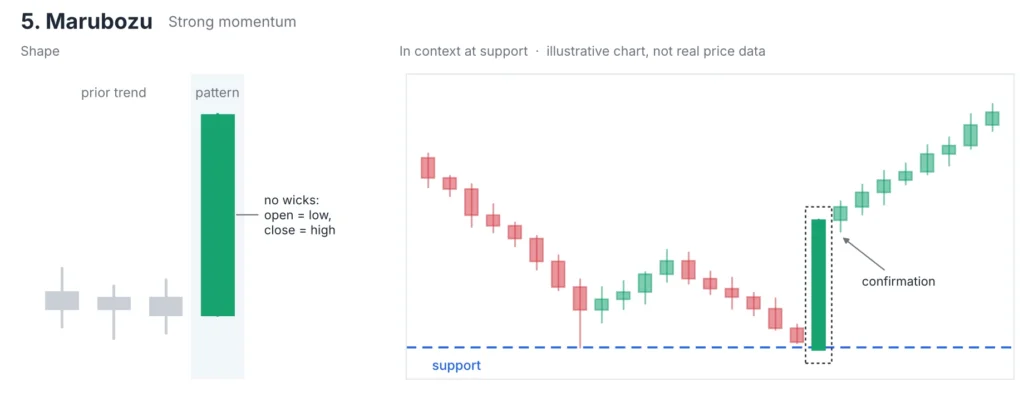
Bullish marubozu leaving a support level
- Shape: a full body with no wicks, or almost none: a bullish marubozu opens at the low and closes at the high; a bearish one does the reverse.
- Pressure: one side controlled the whole session. Leaving a support or resistance level, it shows commitment rather than a tentative move.
- Confirmation: follow-through in the same direction and no immediate retrace of the whole candle. A marubozu straight into a nearby opposing level often stalls.
Two- and Three-Candle Patterns
Multi-candle patterns record a shift across sessions, so they form less often and usually carry a clearer story. They still need a level and a confirming close.
Bullish Engulfing
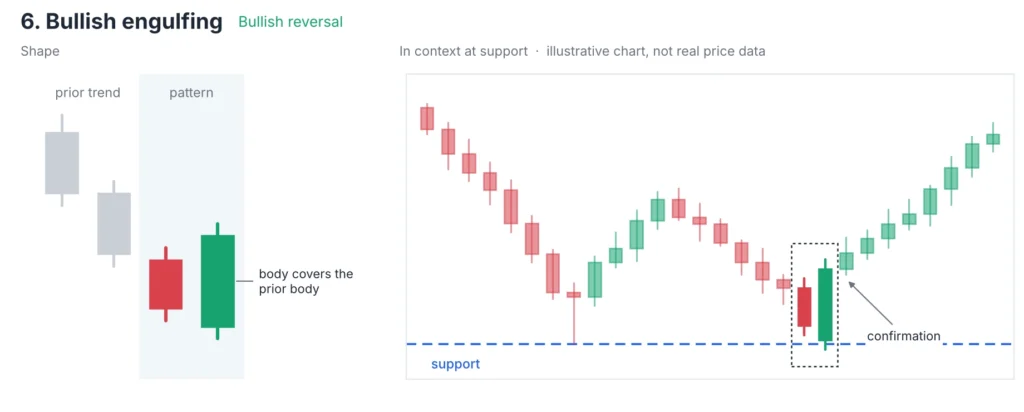
Bullish engulfing: two-candle reversal at support
- Shape: after a decline, a bearish candle and then a bullish candle whose body fully covers the prior body.
- Pressure: sellers held the first session; buyers then took back all of it and more. The larger the second body relative to the first, the clearer the shift.
- Confirmation: a close above the engulfing candle’s high, ideally holding above the support level it formed on.
Bearish Engulfing
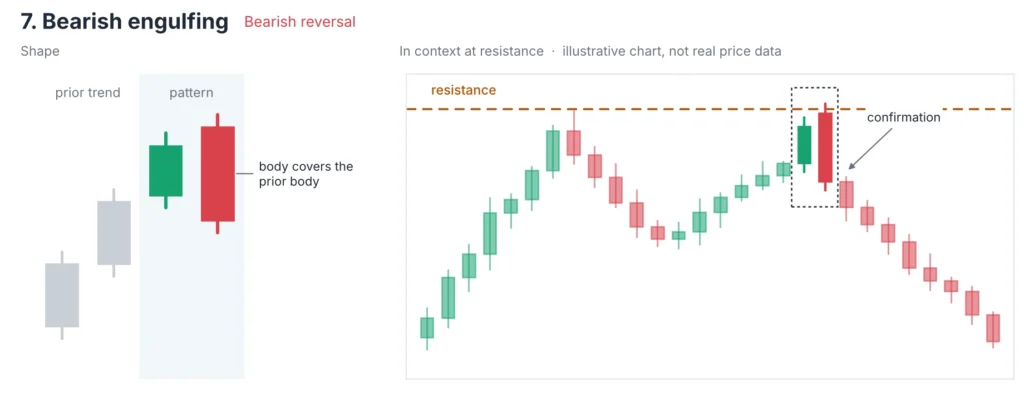
Bearish engulfing: two-candle reversal at resistance
- Shape: at the end of a rally, a bullish candle and then a bearish one whose body covers it completely.
- Pressure: the mirror of the bullish version. Buyers’ gains from one session are erased and exceeded in the next.
- Confirmation: a close below the engulfing candle’s low. At a resistance level that has rejected price before, the pattern deserves more attention than in open space.
Harami (Bullish and Bearish)
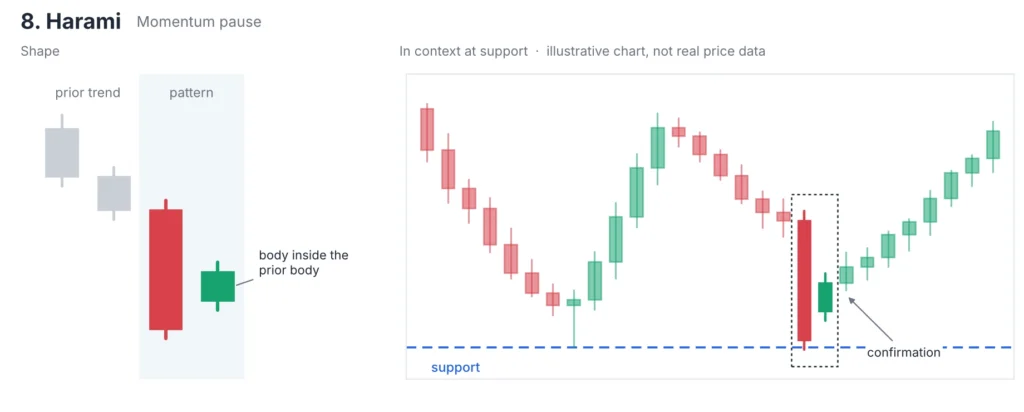
Harami: small body inside the prior candle, near support
- Shape: a large candle, then a small one whose body sits inside the first body. Bullish harami: large bearish then small bullish, after a decline. Bearish harami: the reverse, after a rise.
- Pressure: the strong move has paused. The second session could not continue the first, but it has not reversed it either.
- Confirmation: a break of the large candle’s range in the new direction. A harami says momentum has faded, not that it has turned.
Morning Star
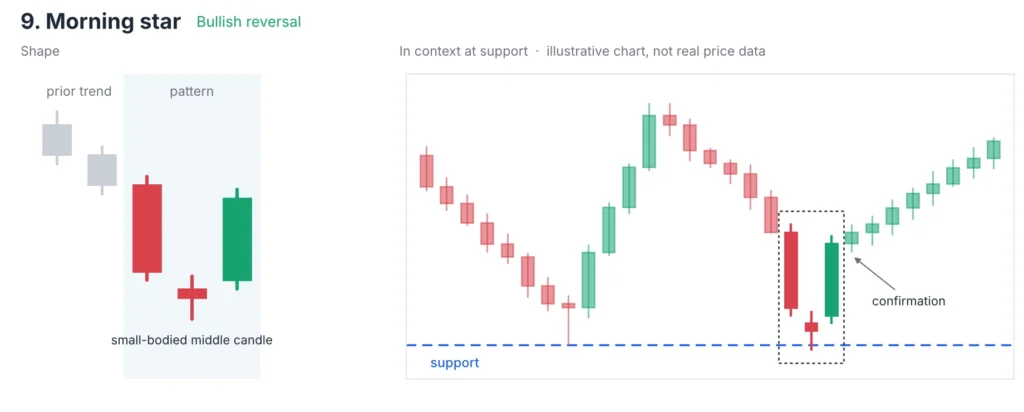
Morning star: three-candle bottom at support
- Shape: a long bearish candle, a small-bodied candle that extends lower, then a long bullish candle closing at least halfway up the first candle’s body.
- Pressure: selling, then hesitation at the low, then buyers taking control. In forex, which trades through the week, the gaps shown in textbook versions rarely appear; the bodies tell the story instead.
- Confirmation: the third candle is part of the pattern. Its close past the midpoint of the first body, at a support level, is the signal.
Evening Star
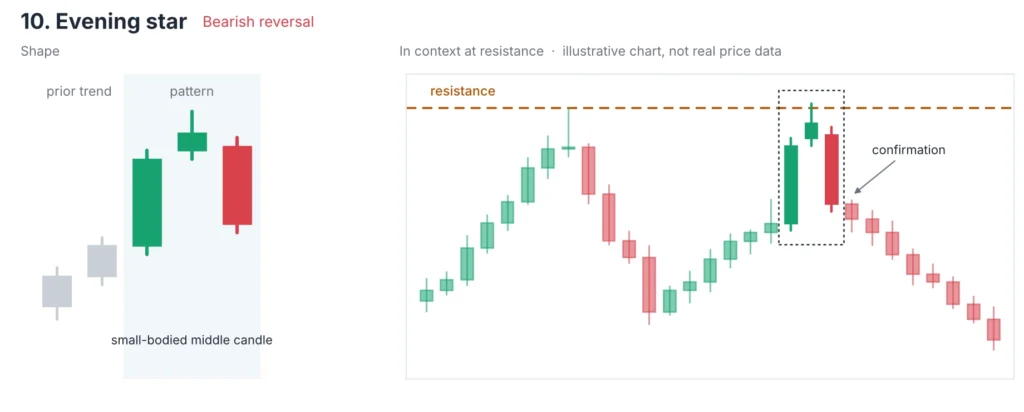
Evening star: three-candle top at resistance
- Shape: a long bullish candle, a small-bodied candle that extends higher, then a long bearish candle closing at least halfway down the first candle’s body.
- Pressure: the mirror of the morning star: buying, hesitation at the high, then sellers taking over.
- Confirmation: the third candle’s close past the midpoint of the first, ideally just below a resistance level the middle candle tested.
Three White Soldiers
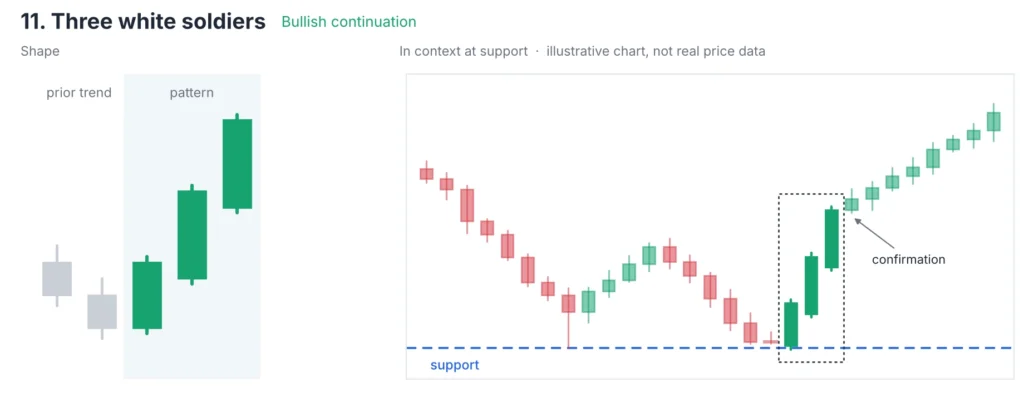
Three white soldiers rising from support
- Shape: three consecutive bullish candles, each opening within the prior body and closing near its own high, at progressively higher levels.
- Pressure: buyers in control for three sessions in a row, without large upper wicks to show selling into strength.
- Confirmation: price holding above the first soldier’s open. After a long advance, three soldiers into resistance can mark exhaustion rather than strength.
Three Black Crows
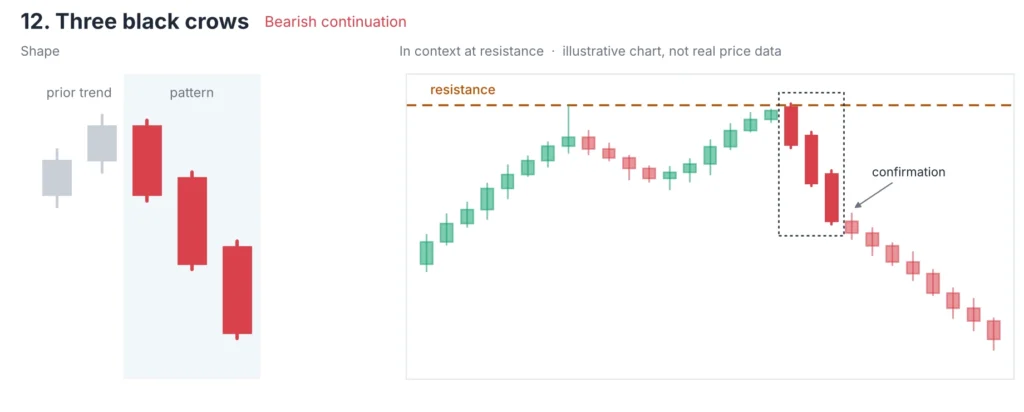
Three black crows falling from resistance
- Shape: three consecutive bearish candles, each opening within the prior body and closing near its low, at progressively lower levels.
- Pressure: sustained selling across three sessions, with little buying on the way down.
- Confirmation: price holding below the first crow’s open. Three crows that land on a major support level often pause there.
Context Decides Everything
The same shape can mean something or nothing depending on where it forms. A hammer in the middle of a range, far from any level, tells you only that one session had a long lower wick.
Three questions decide whether a pattern deserves attention. Is it at a level that has mattered before? Our guide to support and resistance covers how to mark one. Does it form after a move in the opposite direction, so there is something to reverse? And does the next candle confirm it? A pattern that meets all three is a reason to look closer. One that meets none is noise, however textbook the shape.
These formations are also small pieces of larger structures. A head and shoulders or a double top often contains several of the patterns above at its turning points; the forex chart patterns guide covers those multi-candle formations.
Why H4 and D1 Signals Beat M5
A candle on a higher timeframe aggregates far more trading than one on a lower timeframe. A D1 hammer reflects a full day of buyers and sellers testing a level; an M5 hammer can come from one large order or a brief spread widening.
Costs point the same way. Spread is a fixed charge, so it is a large share of an M5 candle’s range and a small share of a D1 candle’s. A pattern that needs a few pips of follow-through to pay off can be swallowed by the spread on a short timeframe.
Many traders use H4 or D1 to find the pattern and the level, then a lower timeframe only to refine the entry. Our guide to forex time frames explains how to pair them.
How Reliable Are Candlestick Patterns?
Less reliable than many guides suggest, and the published evidence is mixed. The most widely cited academic test, by Marshall, Young and Rose (Journal of Banking & Finance, 2006), examined candlestick signals on Dow Jones Industrial Average stocks from 1992 to 2002. Using bootstrap tests, the authors found no evidence that the signals reliably predicted price moves in the expected direction.
That study covers US stocks, not currencies, and it tested patterns mostly in isolation, without the level and confirmation filters described above. It does not prove that candlestick patterns are useless in forex. It does mean that any claimed success rate should come with its source, its market, its period and its rules, and that a pattern on its own is not an edge.
Used well, they are a way to read pressure at a level you already care about and to time an entry with a defined stop beyond the pattern’s extreme. They are a tool inside a plan, not the plan.
Risk Warning
No candlestick pattern guarantees a move. Patterns fail regularly, including textbook ones at strong levels, and a confirming candle can be followed by a full reversal. Place a stop beyond the pattern’s high or low, size the position so that a stop-out costs a small, fixed share of your account, and treat every pattern as a probability, not a promise. Trading forex and CFDs carries a high risk of loss.
Candlestick Patterns FAQ
What are candlestick patterns in forex?They are shapes formed by one to three candles that show how buying and selling pressure changed. Examples include the doji, hammer, engulfing and morning star. They matter most at support or resistance and after a confirming candle.
Which candlestick patterns are most useful for beginners?The hammer, shooting star and the two engulfing patterns are the easiest to spot and have clear confirmation rules. Learn to find them at marked levels on H4 or D1 before adding the rest.
What timeframe works best for forex candlestick patterns?Higher timeframes such as H4 and D1 produce fewer, more meaningful patterns, because each candle reflects more trading and the spread is a smaller share of its range.
Is a doji bullish or bearish?Neither on its own. A doji shows indecision. Its meaning comes from where it forms and from the next candle’s close.
What is the difference between a candlestick pattern and a chart pattern?Candlestick patterns span one to three candles. Chart patterns, such as head and shoulders or triangles, form over many candles and define larger price structures.
Do candlestick patterns work?Published research on stock markets has found little evidence that candlestick signals alone predict prices. Traders who use them pair them with levels, higher timeframes, confirmation and fixed risk per trade.
The Takeaway
Twelve shapes cover most of what candlestick patterns can tell you: indecision, rejection, momentum and reversal. Read them only at a level, on a higher timeframe and after confirmation, and always with a stop beyond the pattern. A free PrimusDEMO account on MT4, MT5 or WebTrader lets you mark levels and practise spotting these patterns before real money is involved.
Risk disclosure. This article is for informational and educational purposes only and is not financial advice, legal advice or tax advice. Trading forex and CFDs carries a high risk of loss and is not suitable for every investor. Past performance does not guarantee future results, and historical pattern behaviour is no indication of future outcomes. Context charts are illustrative and do not show real price data. Research findings are as reported by the study’s authors for the market and period tested. Review the full terms and conditions, the Client Agreement and the Risk Disclosure before trading.