
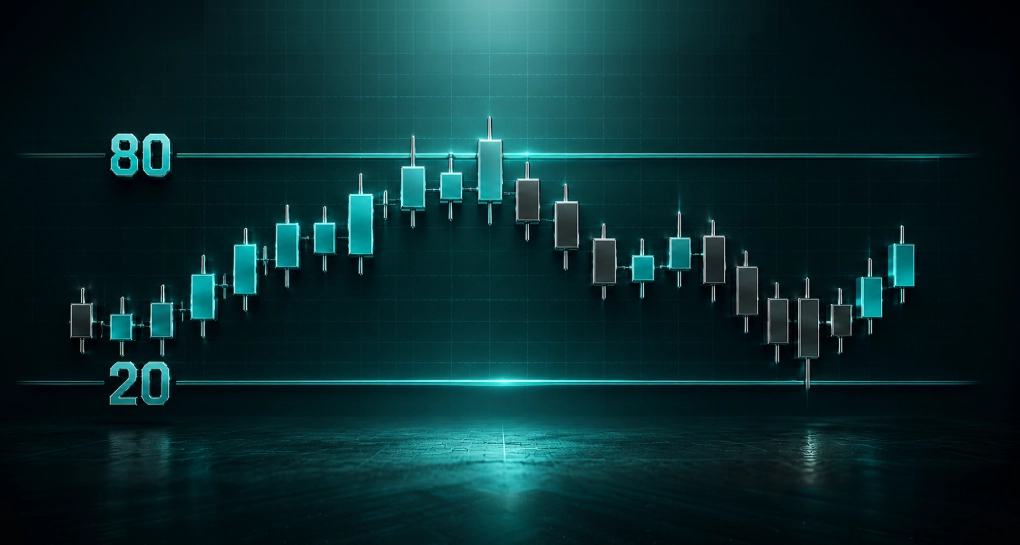
Quick answer: The stochastic indicator measures where the latest close sits inside the recent high-low range, on a 0–100 scale. A reading of 77.5 means the close is 77.5% of the way up the last 14 bars’ range. It plots two lines — %K and its smoothed average %D — with 80 and 20 marking overbought and oversold. The signals mean-revert well in ranges and fire against the move relentlessly in trends.
George Lane’s premise from the 1950s still defines the tool: momentum changes direction before price does, and the position of the close inside the recent range is a readable proxy for that momentum. The stochastic turns the idea into two lines and three numbers — a lookback, a smoothing, and a pair of thresholds — that sit on more retail charts than almost anything except RSI and moving averages.
This guide covers what the indicator computes, the %K and %D arithmetic with a worked example, the MetaTrader settings catch, what the 80/20 bands do and do not mean, the standard signal types, how the tool differs from RSI, and the failure modes that come with it.
What the Stochastic Indicator Measures
The stochastic answers one narrow question: where did price close relative to the highest high and lowest low of the last N bars? A close at the very top of that range reads 100; at the very bottom, 0; exactly in the middle, 50.
The logic behind the question comes from observed closing behaviour. In a sustained advance, closes cluster near the top of each period’s range; as the advance tires, closes start slipping toward mid-range even while highs still edge upward. The indicator is built to surface that slippage early — which is also why it is fast, jumpy and wrong often: it reacts to every twitch in where a single close lands.
Like every tool on a chart, it describes the recent past. It assigns no probabilities to the future, and readings from any backtest are historical observations, not forecasts. Past performance does not guarantee future results.
%K and %D: The Two Lines Explained
%K — the raw reading. The formula:
%K = (Close − Lowest Low) ÷ (Highest High − Lowest Low) × 100
over a lookback of N periods, with 14 as the textbook default. A worked EUR/USD example: over the last 14 bars the highest high is 1.0920, the lowest low is 1.0840, and the current close is 1.0902. The range is 80 pips and the close sits 62 pips above the low:
(1.0902 − 1.0840) ÷ (1.0920 − 1.0840) × 100 = 77.5
%D — the signal line. %D is a 3-period simple moving average of %K. If the last three %K values are 77.5, 82.0 and 71.3, then %D = 76.93. %D smooths the jumpiness out of %K, and the relationship between the two lines — which is on top, and when they cross — carries most of the signal content.
Fast, slow and full. The variants differ only in how much smoothing is applied before the lines are drawn:
| Variant | %K line | %D line | Character |
|---|---|---|---|
| Fast | Raw %K | SMA(3) of %K | Most responsive, most noise |
| Slow | SMA(3) of raw %K (“slowing”) | SMA(3) of slowed %K | The common charting default |
| Full | SMA(any) of raw %K | SMA(any) of that | User-defined smoothing on both |
Slow stochastic is what most traders mean by “the stochastic”: the raw line is smoothed once before display, and %D smooths it again.
The MetaTrader Settings Catch: 5,3,3 by Default
Settings are where charts silently disagree. The Stochastic Oscillator bundled with MT4 and MT5 — checked on a live MT5 build in August 2026 — defaults to %K period 5, %D period 3, slowing 3, with Low/High as the price field and simple averaging. The textbook configuration, and the default on several other charting packages, is 14,3,3.
The difference is not cosmetic. A 5-period lookback reads the close against roughly one week of daily bars instead of three, so the MetaTrader default reaches 80 and 20 far more often, crosses its bands sooner, and generates several times the signal count of a 14,3,3 build on the same chart. Two traders discussing “a stochastic sell signal” on the same pair can be looking at different indicators without knowing it.
Neither setting is correct in any provable sense — 5,3,3 suits short-horizon trading, 14,3,3 filters more — but a rule tested on one and executed on the other is a different system. Set the periods deliberately, note them in the trading plan, and keep them identical between backtest and live chart.
Overbought and Oversold: What 80 and 20 Actually Mean
Readings above 80 are conventionally labelled overbought — the close is parked in the top fifth of the recent range — and readings below 20 oversold. The labels are descriptions of position, not instructions to trade. That distinction carries the entire practical value of the tool.
We put numbers on it in August 2026 by running a 14,3,3 slow stochastic over simulated price series, 300 runs of 250 bars per configuration:
- On trendless series, the classic band signals — %K falling back through 80 (sell) or rising back through 20 (buy) — fired about 22 times per 250 bars, split evenly between the two sides. Roughly a signal every 11–12 bars, with no directional information in the data at all.
- On series with a steady upward drift, %K spent 66% of all bars above 80, and the signal mix inverted: about 11.5 counter-trend sell signals per 250 bars against 4 buys. The indicator spent most of the trend “overbought” and spent most of its signals arguing with the move.
Both results follow from the construction. In a trend, closes keep landing near the top of every rolling range, so the reading pins high and stays there — an extended reading above 80 is evidence of trend strength at least as often as it is a warning of reversal. Selling a market because the stochastic is above 80 is, statistically, mostly selling strength.
The workable interpretation: in a defined range, band exits mark fading pushes toward the edges and mean-revert usefully. In a trend, the bands mark nothing but the trend itself, and the tool needs a filter deciding which regime is in force before any signal is taken.
How Traders Use Stochastic Signals
Band-exit reversals in ranges. The classic use, and the one the simulation supports: within an established sideways structure, %K returning from beyond 80 or 20 flags a fading push toward the range edge. Location does the heavy lifting — the signal is taken at support or resistance, not anywhere the line happens to turn.
%K/%D crossovers. %K crossing below %D from above 80, or above %D from below 20, is the sharper-timed version of the band exit. Crossovers occurring mid-scale, between the bands, are generally ignored — they fire constantly and carry the least information.
Divergence. Price posts a new extreme that the stochastic refuses to confirm — a higher high in price against a lower high in %K, or the mirror at lows. As with MACD divergence, it flags decelerating momentum rather than scheduling a reversal, and strong trends can diverge repeatedly before turning.
Trend-filtered entries. The most defensible framework pairs the tool with a direction filter: take only oversold signals while price holds above a rising 50- or 200-period moving average, only overbought signals below a falling one. The filter deletes the counter-trend half of the signal stream — which, per the numbers above, is most of the losing half in a trend.
Whatever the entry logic, the stochastic supplies no stop distance and no target. Position sizing, a volatility-based stop and a defined risk-reward ratio have to come from the rest of the plan.
Stochastic vs RSI
The two oscillators are cousins, asked for by the same traders and often plotted together, but they compute different things:
| Stochastic | RSI | |
|---|---|---|
| Input | Close’s position within the high-low range | Average size of up-closes vs down-closes |
| Scale markers | 80 / 20 | 70 / 30 |
| Speed | Faster, jumpier | Smoother |
| Lines | Two (%K and %D) — built-in crossovers | One line by default |
| Typical strength | Timing inside ranges | Reading momentum regimes and divergence |
Because both are momentum readings on a 0–100 scale, they agree most of the time — plotting both and treating the agreement as confirmation double-counts one piece of information. Pairing either with a tool that measures something different — structure, volatility, trend direction — adds more than pairing them with each other. The RSI guide covers the other half of this comparison in the same depth.
Where the Stochastic Fails
Trends are its blind spot. The simulation above quantifies the failure: pinned readings, counter-trend signals outnumbering with-trend ones roughly three to one. Used without a regime filter, the tool’s default behaviour in a trend is generating early, repeated, losing reversal calls.
Speed cuts both ways. The same responsiveness that makes it useful for timing in ranges makes the raw and short-period versions relentless noise generators. The MetaTrader 5,3,3 default sits at the noisy end of that spectrum.
Mid-scale readings say little. Between 20 and 80 the indicator mostly wanders. Systems built on mid-scale crossovers inherit the highest false-signal rate the tool can produce.
It cannot see levels. A reading of 15 at a major support level and a reading of 15 in freefall through empty space look identical on the indicator panel. Location on the price chart decides which one is a setup.
Adding the Stochastic on MT4, MT5 or WebTrader
On MetaTrader, open Insert → Indicators → Oscillators → Stochastic Oscillator, set the %K period, %D period and slowing — change the defaults to 14,3,3 if the textbook behaviour is wanted — and the levels 80 and 20 draw automatically in a panel beneath the chart. The same indicator sits in WebTrader’s oscillator group.
FXPrimus provides MT4, MT5 and WebTrader across forex, metals, indices and energies, with Negative Balance Protection on every live account. A free PrimusDEMO account is the sensible place to compare 5,3,3 against 14,3,3 on the same pair — the difference in signal count is visible within a few sessions and costs nothing to observe.
Stochastic Indicator — FAQ
What is the stochastic indicator?
It is a momentum tool that measures where the latest close sits within the highest high and lowest low of the last N bars, scaled 0–100. It plots the raw reading (%K) and a 3-period average of it (%D), with 80 and 20 marking the overbought and oversold bands.
How is the stochastic calculated?
%K equals the close minus the lowest low of the lookback, divided by the full high-low span of the lookback, times 100. With a 14-bar high of 1.0920, low of 1.0840 and a close at 1.0902, %K is 77.5. %D is a 3-period simple moving average of %K.
What do %K and %D mean?
%K is the fast line — the current position of the close inside the recent range. %D is the slow line — a smoothed average of %K. Traders read %K crossing %D near the 80 and 20 bands as the standard signal, and ignore crossings in the middle of the scale.
Which stochastic settings should I use?
No setting is provably best. The textbook default is 14,3,3; MetaTrader ships with 5,3,3, which reacts faster and signals far more often. Shorter lookbacks suit shorter holding times at the cost of noise. Whichever is chosen, backtest and live chart must use the same numbers.
What does overbought mean on the stochastic?
A reading above 80 means the close sits in the top fifth of the recent range — a description of position, not a sell instruction. In ranges, such readings often precede pullbacks; in uptrends, the reading can stay above 80 for most of the move while price keeps rising.
Is the stochastic better than RSI?
Neither dominates — they measure different inputs on similar scales. The stochastic reads the close’s position in the range and moves faster with built-in %K/%D crossovers; RSI reads average gain against average loss and runs smoother. Since both track momentum, combining them adds little beyond one of them.
Does the stochastic work in trending markets?
Poorly on its own. In our simulated steady uptrend it spent 66% of bars above 80 and produced roughly three counter-trend sell signals for every buy. It becomes usable in trends only behind a direction filter, such as trading its signals exclusively with the slope of a longer moving average.
Is stochastic a leading or lagging indicator?
It is commonly called leading because closes drift off the range extremes before price visibly turns, but it forecasts nothing — it reacts to the most recent close. In practice it is an early-warning momentum gauge with a high false-alarm rate, which is why it is paired with structure and a stop.
The Takeaway
The stochastic indicator compresses one observation — where the close landed inside its recent range — into two fast lines and two bands. Read literally, in a range, at a level, behind a trend filter, it times entries as well as anything in the oscillator family. Read as a standalone buy-below-20, sell-above-80 machine, it spends trends fighting the market and ranges firing every eleven bars, and the settings on the chart may not even match the ones in the book. Define the regime first, the settings second, and let the risk plan — stop, size, target — do the part no oscillator can.
FXPrimus offers MT4, MT5 and WebTrader with Negative Balance Protection on every live account, plus a free PrimusDEMO account for testing stochastic settings before committing capital.
[→ Open a PrimusDEMO account] | [→ Compare account types]
Risk disclosure. This article is published for informational and educational purposes and is not financial advice, legal advice or tax advice, nor a recommendation to trade any instrument or to use any indicator or strategy. Trading forex and CFDs carries a high risk of loss and is not suitable for every investor; you may lose more than your initial deposit unless Negative Balance Protection applies. Past performance does not guarantee future results, and simulated or backtested figures do not reflect live execution costs. Performance statistics published by signal providers and strategy sellers are often self-reported and should be verified against underlying statements. Spreads and trading conditions referenced are indicative, self-reported by FXPrimus, and vary by account type. Review the full terms and conditions and the relevant risk disclosure before opening an account or placing a trade. FXPrimus is a trading name of entities regulated in multiple jurisdictions; the entity you contract with, and the protections that apply, depend on your country of residence.