

The Relative Strength Index (RSI) is one of the most widely used momentum indicators in technical analysis. Whether you’re trading forex, indices, or commodities, RSI helps traders identify overbought conditions, oversold levels, trend strength, and potential reversals.
In this guide, you’ll learn what RSI is, how it works, how to read RSI signals, and how traders use it in real market conditions—all explained step by step.FXPrimus trading platforms, such as MT4, MT5, and WebTrade,r include built-in RSI tools, making it easy to apply everything discussed here in live or demo trading.
What Is the Relative Strength Index (RSI)?
The Relative Strength Index (RSI) is a momentum oscillator developed by J. Welles Wilder Jr. It measures the speed and magnitude of recent price changes to determine whether an asset is overbought or oversold.
RSI is displayed as a line that oscillates between 0 and 100:
- Above 70 → Overbought
- Below 30 → Oversold
Traders use RSI to:
- Identify momentum shifts
- Spot potential trend reversals
- Confirm trend strength
How the RSI Works
RSI compares average gains to average losses over a selected period—most commonly 14 periods.
When price rises strongly, RSI moves higher. When the price falls sharply, RSI moves lower.
Instead of predicting price direction, RSI helps traders understand momentum behaviour, which is why it’s often combined with trend analysis and price action.
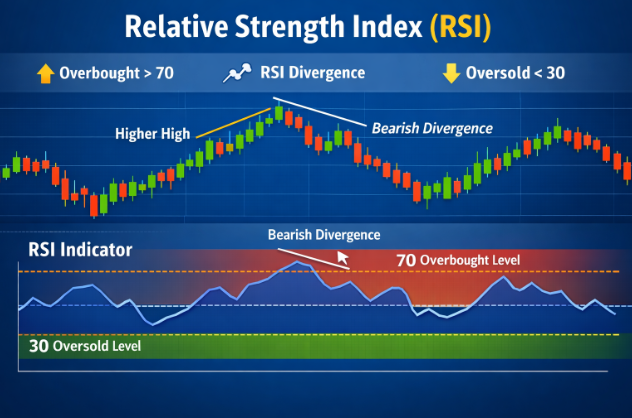
RSI indicator showing overbought and oversold zones:
Why Is RSI Important?
RSI is important because it:
- Helps traders avoid buying at market tops
- Helps identify potential pullbacks and reversals
- Works across all timeframes
- Can be applied to forex, indices, stocks, and commodities
For FX traders, RSI is especially useful in range-bound markets, which are common in many currency pairs.
Modify RSI Levels to Fit Trends
- Uptrend: RSI often stays between 40–80
- Downtrend: RSI often stays between 20–60
Using fixed 30/70 levels in strong trends may lead to early exit signals.
Use Buy and Sell Signals That Fit Trends
- Buy pullbacks when RSI holds above trend support
- Sell rallies when RSI fails near resistance levels
What Is a Bullish RSI Number?
A bullish RSI typically:
- Holds above 50
- Forms higher lows
- Moves into the 60–80 zone during strong uptrends
RSI staying above 50 often signals bullish momentum control.
What Is a Bearish RSI Number?
A bearish RSI typically:
- Remains below 50
- Forms lower highs
- Drops into the 20–40 zone during downtrends
This suggests sellers are dominating price action.
Interpretation of RSI and RSI Ranges
| RSI Level | Interpretation |
| Above 70 | Overbought |
| Below 30 | Oversold |
| 50 | Momentum balance |
| 40–60 | Range-bound market |
| 20–80 | Trending market behaviour |
Example of RSI Divergences
RSI divergence occurs when price and RSI move in opposite directions.
- Bullish divergence: Price makes lower lows, RSI makes higher lows
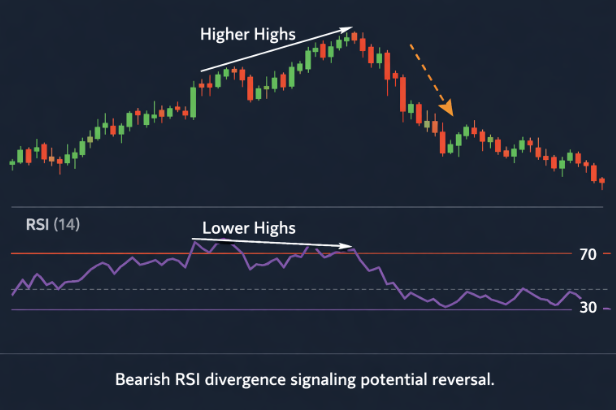
- Bearish divergence: Price makes higher highs, RSI makes lower highs
This often signals weakening momentum.
Bearish RSI divergence signalling potential reversal.
Example of Positive-Negative RSI Reversals
- Positive reversal: RSI forms a higher low while price forms a higher low (bullish continuation)
- Negative reversal: RSI forms a lower high while price forms a lower high (bearish continuation)
These are trend continuation signals, not reversals.
Example of RSI Swing Rejections
RSI swing rejection involves:
- RSI enters overbought/oversold zone
- Pulls back
- Fails to return to the extreme
- Breaks the previous RSI level
This often confirms momentum continuation.
The Difference Between RSI and MACD
| Feature | RSI | MACD |
| Type | Momentum oscillator | Trend-following |
| Best for | Ranges & momentum | Trend confirmation |
| Scale | 0–100 | Unbounded |
| Signals | Overbought/oversold | Crossovers & divergence |
Many traders use RSI + MACD together for stronger confirmation.
Limitations of the RSI
RSI is powerful, but not perfect:
- Can stay overbought/oversold in strong trends
- Generates false signals in volatile markets
- Should not be used alone
Combining RSI with support/resistance, trendlines, or moving averages improves accuracy.
What Is a Good RSI Number to Use?
- Default: 14-period RSI
- Short-term traders: 7–9 periods
- Long-term traders: 21 periods
There is no “best” RSI setting—only what fits your trading style.
What Is the Difference Between RSI Divergence and RSI Reversal?
- Divergence: Momentum warning
- Reversal: Confirmed momentum shift
Divergence suggests possibility, reversal confirms action.
How to Use RSI in Trading
Reading RSI Signals
- Buy when RSI rebounds from oversold in uptrends
- Sell when RSI rejects overbought in downtrends
- Use RSI + price structure for confirmation
FXPrimus platforms allow traders to customize RSI settings, levels, and timeframes easily.
Understanding the RSI Formula
RSI Formula:
RSI = 100 − (100 / (1 + RS))
Where:
- RS = Average Gain ÷ Average Loss
- Calculated over a set number of periods (usually 14)
You don’t need to calculate this manually—RSI is automatically plotted on FXPrimus trading platforms.
What Are the Advantages and Disadvantages of RSI?
| Advantages | Disadvantages |
| Easy to understand | Can give early signals |
| Works across markets | Less reliable alone |
| Identifies momentum clearly | Requires confirmation |
Practical RSI Trading Strategies
- RSI + trendline strategy
- RSI divergence + support/resistance
- RSI swing rejection strategy
- RSI + moving average confirmation
These strategies are commonly applied by traders using FXPrimus MT4 and MT5 platforms.
FAQs:
Why is it important to adjust RSI periods for different trading timeframes?
Different timeframes display price movement at different speeds. Adjusting the RSI period allows traders to align the indicator’s sensitivity with the timeframe being observed, which may change how price momentum is visually represented on the chart.
Why are RSI swing movements sometimes observed instead of relying only on overbought or oversold levels?
Overbought and oversold levels highlight strong price movement. RSI swing movements may help traders observe changes in momentum over time, rather than focusing on a single level.
Why is RSI commonly used as a supporting tool rather than a standalone signal?
RSI is generally used to complement other forms of market observation, such as price action or risk management considerations. It is not typically relied upon in isolation.
Conclusion
The Relative Strength Index (RSI) remains one of the most effective tools for understanding market momentum. When used correctly—and combined with trend analysis and price action—it helps traders make more informed, disciplined trading decisions.
With FXPrimus, traders can apply RSI seamlessly using professional-grade platforms, fast execution, and advanced charting tools—whether practicing on a demo account or trading live markets.
Risk Warning: Trading forex and CFDs involves significant risk and may not be suitable for all investors. Technical indicators, including RSI, are analytical tools only and do not predict future price movements or guarantee trading outcomes.