
Forex trading may seem complex at first glance, but everything starts with learning how to read trading charts. Understanding charts is the foundation of technical analysis, helping traders identify market trends, entry points, and potential risks.
This guide will walk you through the basics of reading forex trading charts, focusing on candlesticks, chart types, and common patterns—all in a beginner-friendly way.
Introduction to Charts
At its core, a trading chart is a visual representation of how price moves over time. In forex, charts plot currency pairs against chosen timeframes (from minutes to months), helping traders make informed decisions.
Price vs. Time
Every forex chart consists of two key elements:
- Price (Y-axis): Vertical movements show how much a currency pair is worth.
- Time (X-axis): Horizontal movement tracks how price changes over seconds, minutes, hours, or days.
Understanding this relationship is the first step in reading forex trading charts.
Types of Charts
There are three primary chart types:
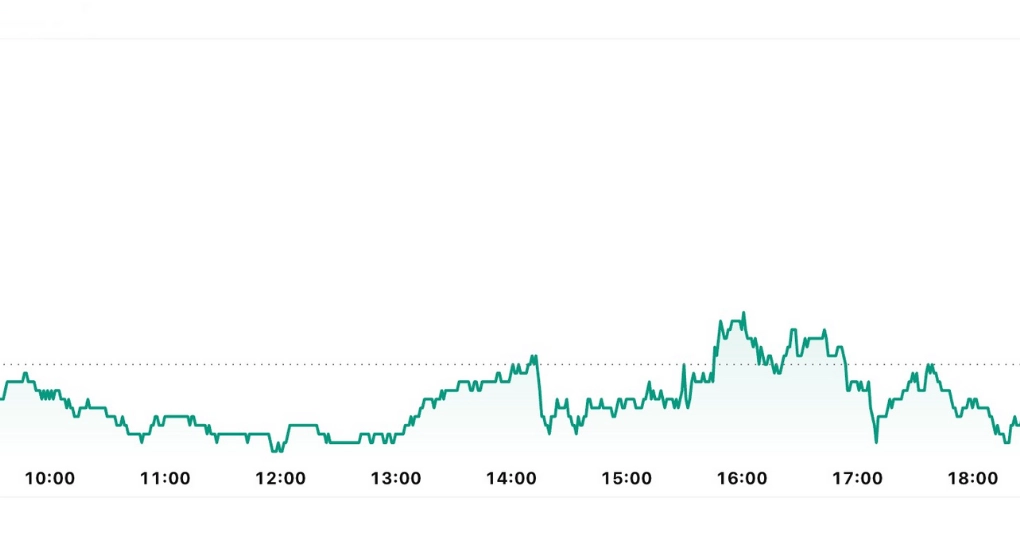
- Line Charts – Connects closing prices with a simple line. Ideal for beginners.
- Bar Charts – Displays open, high, low, and close (OHLC) prices for more detail.
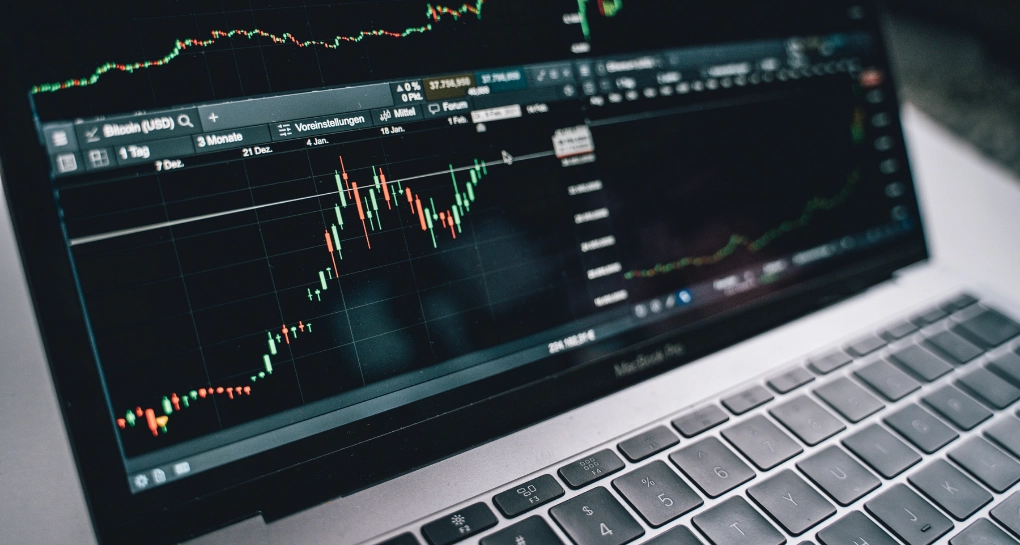
- Candlestick Charts – The most popular chart type, showing the same data as bar charts but in a more visual, color-coded format.
Components of a Candlestick
Each candlestick represents price action during a chosen timeframe. It consists of:
- Body: The difference between opening and closing prices.
- Wick/Shadow: The high and low prices reached.
- Color: Green (bullish) shows price closed higher, red (bearish) shows price closed lower.
How to Read a Candlestick
To read a candlestick:
- Check the open and close to determine if it’s bullish or bearish.
- Look at the wicks for price volatility.
- Analyze multiple candles together to identify patterns.

Common Candlestick Patterns
Patterns help traders predict possible price moves.
Bullish Patterns
- Hammer – Indicates potential reversal after a downtrend.
- Engulfing Pattern – A larger green candle “engulfs” the prior red candle, signaling strength.
Bearish Patterns
- Shooting Star – Suggests a reversal after an uptrend.
- Bearish Engulfing – A strong red candle overtakes a green one, hinting at selling pressure.
Comparing Candlestick Charts to Other Chart Types
While line and bar charts are simpler, candlesticks provide more detail and are easier to interpret visually. That’s why they are the preferred choice for most forex traders.
Practical Applications of Candlestick Charts
Candlesticks help traders with:
- Spotting entry and exit points.
- Confirming trends.
- Identifying potential reversals.
When combined with indicators like moving averages or RSI, candlesticks become even more powerful.
Limitations and Considerations
No chart or pattern guarantees success. Beginners should:
- Avoid relying solely on candlesticks.
- Combine chart reading with risk management.
- Use demo accounts before trading live.
Common Forex Chart Patterns and Their Interpretation
Some widely recognized forex chart patterns include:
- Head and Shoulders – Signals trend reversal.
- Triangles (ascending/descending) – Suggest continuation or breakout.
Double Tops and Bottoms – Show potential reversals.
How to Choose the Right Forex Chart
Beginners often start with candlestick charts, but you can experiment with line or bar charts to see which fits your trading style. FXPrimus provides advanced charting tools, making it easier to switch between chart types.
Frequently Asked Questions
Which chart type is best for beginners in forex trading?
Candlestick charts are usually the best starting point because they show more detail than simple line charts. Each candlestick reveals the opening, closing, high, and low prices, which helps beginners understand price movement at a glance. Once you’re comfortable, you can explore bar or line charts to compare different perspectives.
Why are candlestick charts so popular among traders?
They’re popular because candlesticks are easy to read and give more insights into market psychology. The patterns can help traders spot trends, reversals, and momentum shifts quickly. Their color-coded format also makes it easier to see whether buyers or sellers are in control.
Can I use multiple chart types simultaneously?
Yes, many traders combine chart types for deeper analysis. For example, you might use candlesticks to time your trades but refer to line charts for a broader view of price direction. Beginners should start simple, then add more chart types as they gain confidence.
What time frames should I use for swing trading?
Swing traders often look at daily charts for the main trend, then use 4-hour or 1-hour charts to refine entries and exits. The key is to balance detail with clarity — too many time frames can be confusing. Beginners should start with one or two time frames and build from there.
Do advanced charts like Renko or Heikin-Ashi work better than traditional charts?
They can help highlight trends by filtering out noise, but they’re not necessarily better. Renko and Heikin-Ashi charts provide cleaner signals, though sometimes with delays. Beginners should first master candlestick charts before experimenting with these advanced options.
Final Thoughts on Reading Forex Trading Charts
Learning forex trading and how to read charts is a key skill for every beginner. Candlesticks, indicators, and chart patterns are essential tools that guide trading decisions. But remember—no chart guarantees profits. Always practice on a demo account, apply strong risk management, and use a regulated broker like FXPrimus for secure and professional trading.