
The Volatility 75 Index is a market that moves often and fast. Many beginners see it mentioned online, but do not fully understand how it works. This guide explains the Volatility 75 Index in simple terms.
You will learn what it is, how it behaves, and how beginners can study it using basic trading ideas.
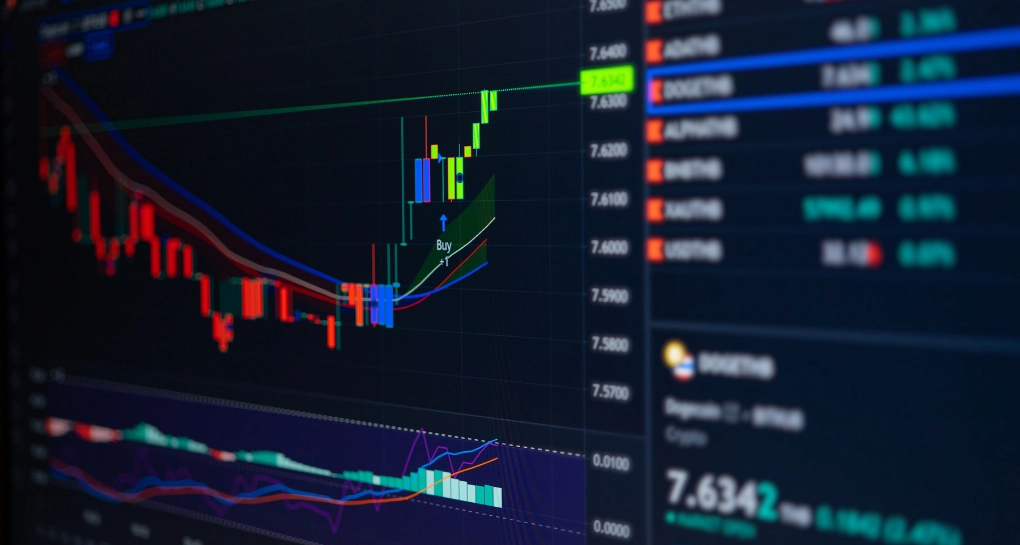
Understanding the Volatility 75 Index: Everything You Need To Know
The Volatility 75 Index is a proprietary synthetic index offered by specific trading platforms. It is not linked to real companies, stocks, or economic events, and its price movements are generated algorithmically with a fixed volatility setting.
As a result, the index is designed to produce frequent price movements, although market behavior can still vary, and outcomes are never guaranteed. When viewing a Volatility 75 Index chart, traders may observe frequent price changes throughout the day, reflecting the index’s high volatility design.
Why Do Traders Study the Volatility 75 Index?
Traders are interested in the Volatility 75 Index because:
- It moves even when other markets are slow
- It runs all day and night
- It does not react to news or reports
- Some traders find that technical patterns can appear more frequently, although identifying and interpreting them correctly requires practice and experience.
Some traders use it as a tool to practice chart reading and technical analysis, but its high volatility means it may not be suitable for all beginners.
How Is the Volatility 75 Index Different From the VIX?
Many new traders confuse the VIX with the Volatility 75 Index.
- VIX measures fear in real stock markets
- Volatility 75 Index is a synthetic market with fixed movement
They are not traded in the same way. The Volatility 75 Index is available only through a volatility 75 index broker that offers synthetic indices.
Understanding the Fundamentals of the Volatility Index 75
There are no company earnings, interest rates, or news events involved. Instead, price movement is driven by:
- Built-in volatility rules
- Random price changes
This is why most traders focus on charts rather than news.
Some Facts About the Volatility 75 Index
- It is available 24 hours a day
- Price moves are frequent
- Because it is synthetic and not news-driven, price gaps related to economic announcements are less common, though sharp movements can still occur.
- Charts may display recurring technical behavior, but price movement remains uncertain and trading outcomes are never predictable.
- Risk management is very important
Understanding these facts helps beginners set realistic expectations.
Best Time to Study the Volatility 75 Index
There is no single best time. Many beginners choose:
- Quiet hours with fewer distractions
- Times when they can focus on charts
- Periods with clear price movement
Consistency matters more than timing.
How Beginners Can Approach Volatility 75 Index Trading
For learning purposes, beginners should:
- Start with a demo account
- Observe the volatility 75 index chart daily
- Practice one strategy at a time
- Keep trade sizes small
- Focus on learning, not profit
This approach builds confidence and discipline.
FAQs:
What specific price behaviors should traders expect from the Volatility 75 Index compared to traditional forex or indices?
The Volatility 75 Index is a synthetic instrument that exhibits frequent price movement based on algorithmic price generation. Its behavior is not linked to real-world market conditions and remains inherently unpredictable. Unlike forex or equity indices, its price is not influenced by economic announcements, political events, or trading sessions; however, this does not reduce trading risk, and losses may occur at any time. Price movements occur continuously and may be more frequent than in traditional markets. This reflects the index’s algorithmic design, rather than real-world market conditions.
How should traders adapt their strategies when market movement becomes unusually fast or slow on the Volatility 75 Index?
Market conditions may vary in speed over time. For this reason, traders typically focus on understanding volatility, margin requirements, and risk exposure, rather than assuming consistent price behaviour. Awareness of how volatility impacts account metrics is important when trading instruments with frequent price changes.
Which technical indicators tend to be commonly used on Volatility 75 Index charts, and why are they used in synthetic markets?
Some traders use basic price-based indicators, such as moving averages or momentum indicators, to help observe price movement. In synthetic markets, these indicators reflect price behavior only, as there are no external fundamental factors influencing price generation.
Conclusion
The Volatility 75 Index is a fast-moving synthetic market designed to show constant price action. It is popular for technical analysis and chart-based learning.
For beginners, the goal is not speed or profit, but understanding how price moves, how strategies work, and how risk should be controlled.
Learn Before You Trade
Understanding volatility is an important step for any new trader. Platforms like FXPrimus provide demo accounts, clear charts, and educational tools that help beginners practice in a controlled environment.
Start by learning, practicing, and building strong trading habits before trading live.
This article is provided for educational and informational purposes only and does not constitute investment advice or a recommendation to trade. Trading leveraged or synthetic instruments involves significant risk and may result in the loss of your entire capital. Always ensure you fully understand the risks before trading.